How can enterprise teams solve revenue data silos?
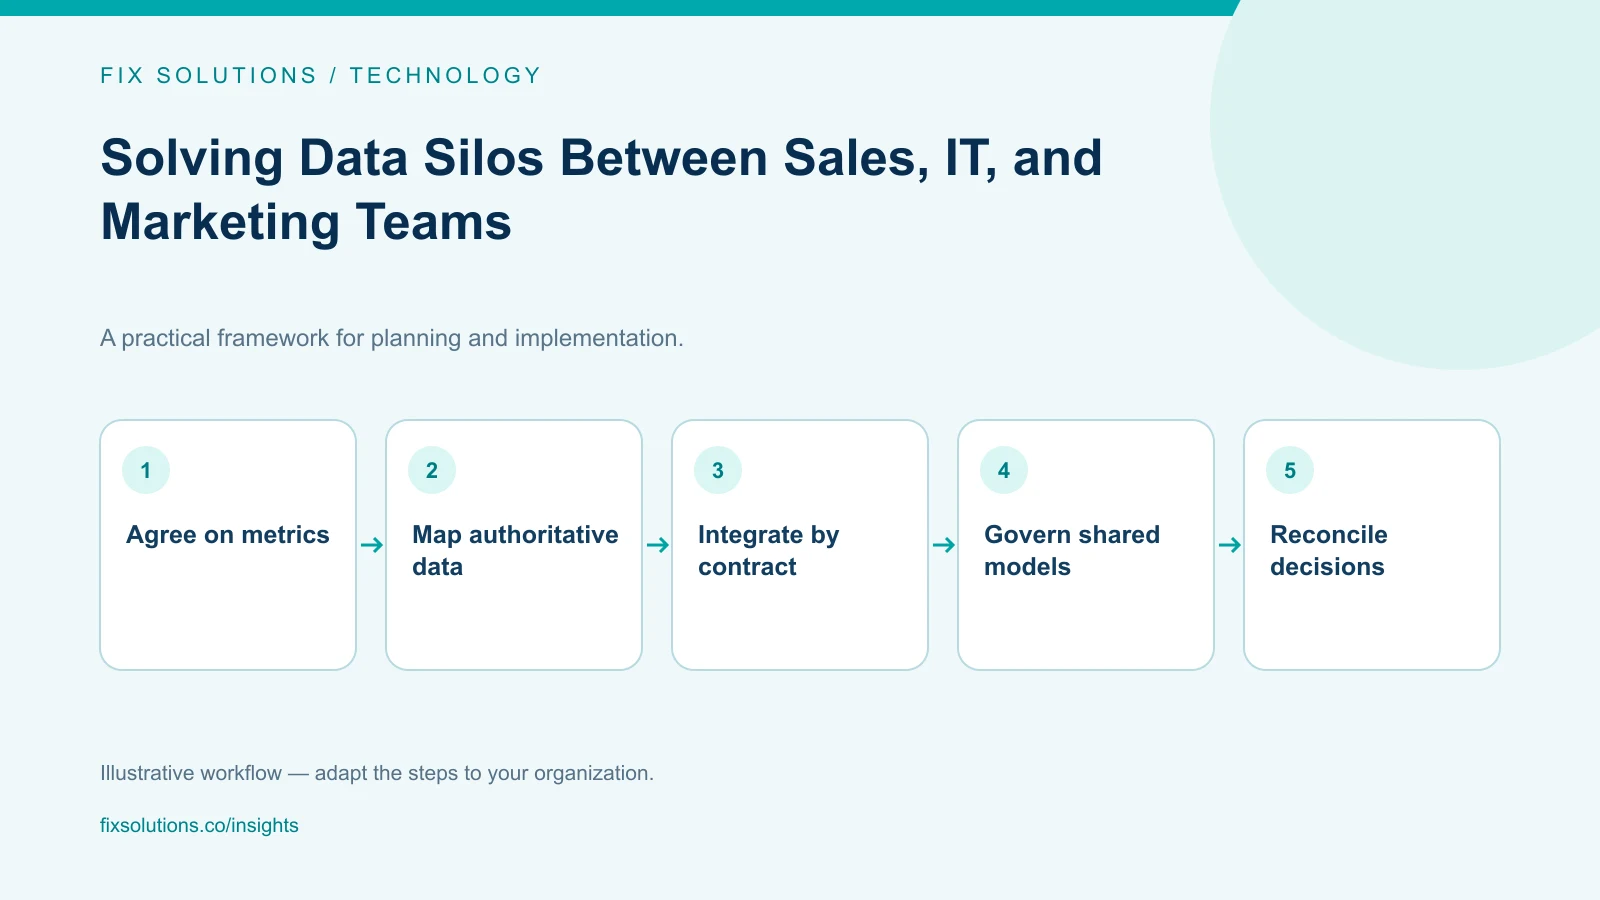
Start with a shared business question, not a company-wide data migration. Agree on what counts as an inquiry, qualified opportunity, influenced revenue and closed business; identify which system owns each fact; then connect only the necessary data through documented interfaces into a governed reporting layer. Reconcile results with source systems and record gaps rather than promising a perfectly complete customer journey.
Sales, marketing and IT can each report accurate numbers that do not agree. Marketing may count form submissions, sales may count accepted opportunities, and finance may recognize revenue only after an invoice or accounting event. A dashboard that joins these records without aligning their meaning can make disagreement look like precision.
The practical goal is not one giant database that replaces every operational system. It is a trusted path from source records to shared measures, with clear accountability for definitions, access, quality and correction. That approach allows leaders to compare investment with outcomes while preserving the systems teams need to run their work.
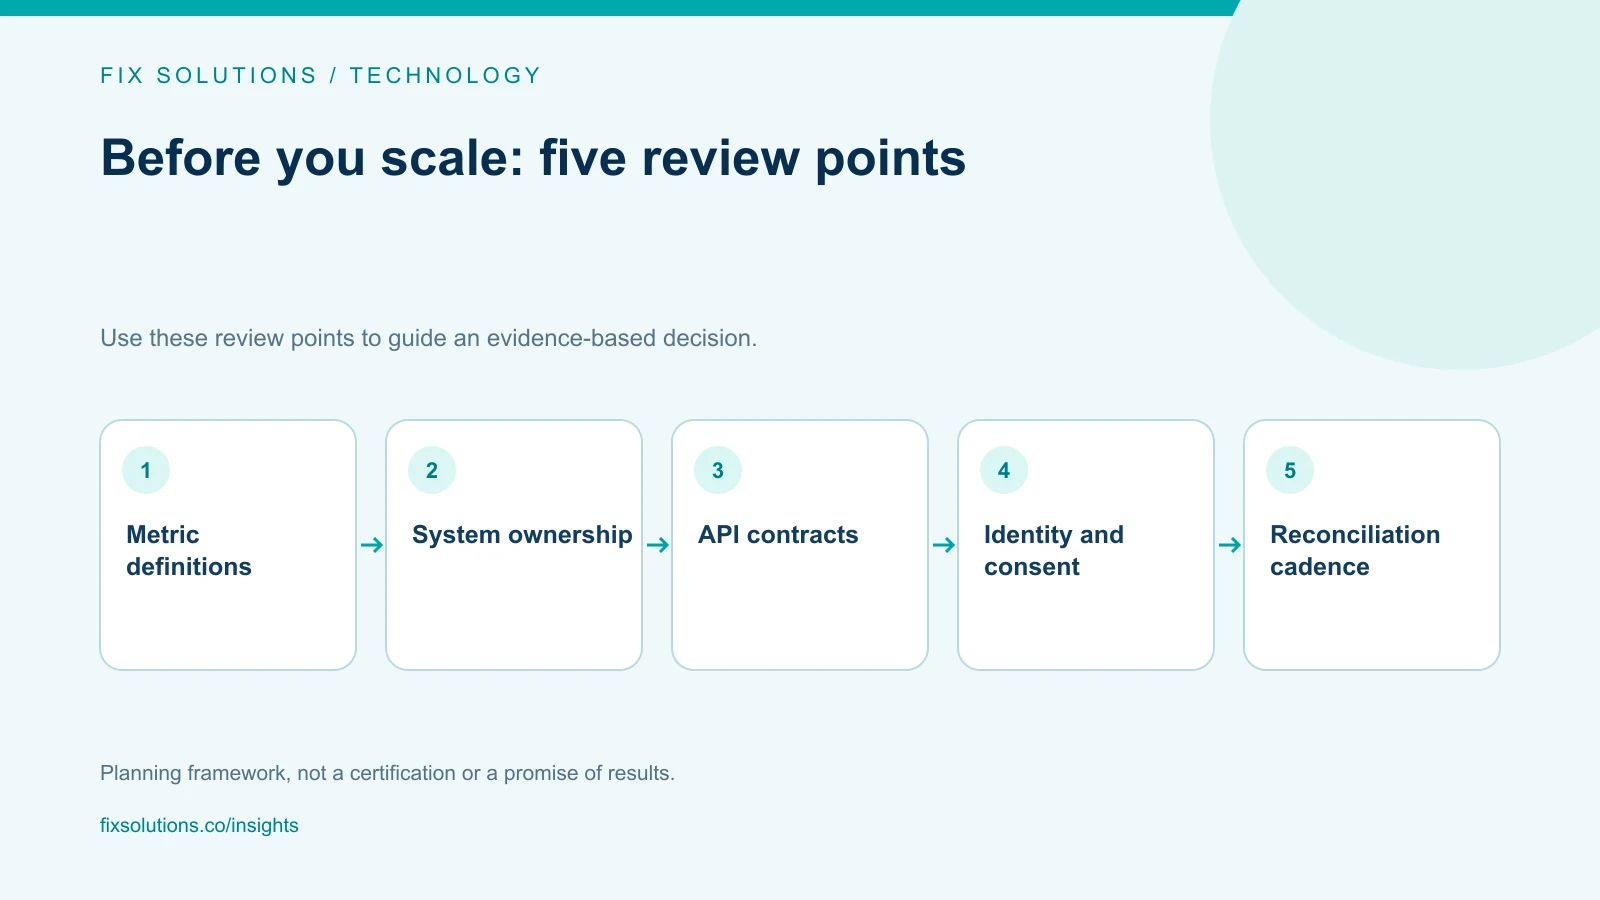
Treat the disagreement as a definition problem first
Before selecting middleware or a lakehouse, choose one decision that current reporting cannot support. It might be whether to invest more in a channel, where qualified deals stall, or how long a sales response takes. Name the decision-maker and the time horizon. A broad request to “unify all customer data” is too vague to guide technical scope.
Then write down the measure in plain language. “Marketing-sourced pipeline” could mean pipeline from a campaign’s first recorded touch, the campaign that created an inquiry, or an opportunity that a campaign influenced at some point. These are different measures. Each can be valid if its definition, attribution window and exclusions are visible.
| Business measure | Agree on before calculating it |
|---|---|
| New inquiry | Which events qualify, and how are duplicates handled? |
| Accepted opportunity | Which CRM stage and acceptance criteria apply? |
| Sourced revenue | Which touch or rule receives primary credit? |
| Influenced revenue | What qualifying interaction and time window count? |
| Recognized revenue | Which finance record and accounting period are authoritative? |
Keep the first version small. A short metric dictionary with an owner and an example is more useful than an extensive glossary no one maintains. Include negative examples too: an email open is not automatically a qualified lead, and a campaign association is not proof that the campaign caused a sale.
Assign authority for every important fact
There is rarely one system that should own every attribute. The CRM may own opportunity stage and sales owner; a marketing platform may own campaign delivery events; an order system may own order status; finance may own recognized revenue. Analytical tools can combine those facts without becoming the editing authority for any of them.
Create a data ownership map that names the authoritative application, accountable business steward, technical contact and refresh expectation for each key entity. Include who can approve a correction and how downstream users will learn that a field changed meaning. If two teams disagree about a value, provide a documented escalation path rather than silently choosing whichever system was easiest to query.
Model relationships at the right level
B2B buying can involve a person, a business account, multiple contacts, a campaign and more than one opportunity. A single contact-to-campaign join may not represent the commercial relationship. Define which IDs link systems, how account hierarchies work, and what happens when records are merged or contacts change companies.
Use stable identifiers where available, but do not assume identifiers are globally unique just because their formats match. Namespace them by source system or map them through a controlled identity table. Preserve provenance so an analyst can trace a dashboard row back to its source record and transformation.
Identity stitching should respect consent and purpose. Anonymous website activity, authenticated product usage and CRM identity have different levels of certainty and sensitivity. Minimize the personal data copied into analytics, document the allowed use, and honor retention and deletion processes. A technical match is not automatically permission to use every event for every purpose.
Choose integration patterns according to the job
APIs for current operational exchange
Use APIs when one system needs to read or update a defined record in another system as part of a business process. Agree on a contract covering fields, authentication, rate limits, retries, error responses, versioning and ownership. An API should expose a stable business capability, not merely mirror another system’s entire database.
For example, a marketing application may need an approved contact status from the CRM before triggering a sales handoff. The API can return the minimum fields required for that decision. Avoid a chain in which a user-facing page waits synchronously on several analytics and marketing services; operational workflows need explicit timeout and fallback behavior.
Events for changes that other systems need to observe
Events can decouple a source from consumers when a meaningful state change occurs, such as an opportunity entering an agreed stage. Include a stable event identifier, event time, entity reference, schema version and source. Consumers should tolerate duplicate delivery and out-of-order arrival; a retry may publish an event more than once.
An event stream is not automatically a clean customer history. Late updates, deletions and backfills need defined handling. Keep a replay or recovery process and make it possible to reconcile the derived view with the authoritative application.
A warehouse or lakehouse for analysis
Analytical stores are appropriate for history, cross-system joins and repeated reporting. Extract operational data in a controlled way, retain source identifiers and ingestion timestamps, and separate raw records from cleaned and business-ready models. A data lake can store diverse files, but without ownership, schema, retention and quality controls it can become another silo with better branding.
Middleware for orchestration and managed connectors
Integration platforms can handle common connectors, routing, transformation and monitoring. They can reduce repetitive plumbing, but they do not decide what “qualified” means or who is allowed to see a record. Evaluate the platform for observability, replay, error queues, secrets management, environment promotion and portability. Avoid hiding critical business logic inside flows that have no owner or review process.
Build a thin, trusted revenue data product
For the first release, choose a narrow set of entities: campaign, contact or account, opportunity and closed outcome. Document the join rules and the timestamp used to associate activity with an outcome. Make the model answer one stated business question, and give it a named product owner who can prioritize changes.
Keep raw source data distinct from normalized and curated data. The raw layer provides traceability; the normalized layer aligns technical representations; the curated layer applies business definitions. Label derived values and expose their calculation logic. Do not overwrite source records to make a chart look consistent.
Each pipeline should expose basic health information: freshness, record counts, rejected or quarantined records, duplicate rates, schema changes and reconciliation differences. Agree on an acceptable delay. A daily refreshed report may be sufficient for quarterly planning but inappropriate for a same-day lead response queue.
Reconcile before calling a dashboard authoritative
Compare sample records from the report to their source systems. Reconcile counts and monetary totals over the same period, accounting for time zones, cancellations, currency conversion and late-arriving records. Investigate material differences, document known exclusions and show when the model last refreshed.
When dashboards disagree, keep a discrepancy log. Record the measure, affected source, suspected cause, owner, decision and correction. This turns “the numbers are wrong” into a manageable data-quality backlog and discourages teams from creating private spreadsheets that reproduce the same ambiguity.
Govern access without blocking useful work
Classify information according to its sensitivity. A revenue report for executives does not necessarily need email addresses, personal browsing events or free-text notes. Apply least-privilege access, separate administration from analysis where practical, and review access when roles change.
Establish review for schema changes that affect shared metrics. The process should be lightweight: publish the proposed change, explain affected consumers, provide a compatibility period when feasible, and identify a person who can approve or coordinate migration. Versioning and clear deprecation dates are safer than silently changing a field that feeds compensation or forecasts.
Security and privacy design must be part of the integration, not a cleanup after launch. Consult the organization’s policies and applicable requirements. The NIST Privacy Framework offers a voluntary structure for privacy risk management, while the OpenAPI Specification documents a standard format for describing HTTP APIs. Neither replaces system-specific legal or security review.
A practical 90-day sequence
Weeks 1–2: select the decision. Interview the people who use the numbers. Agree on a single measure, its exclusions and an accountable owner. Inventory the minimum source records needed.
Weeks 3–4: map authority and risk. Confirm system owners, identifiers, access classification, consent constraints and refresh needs. Write the first data contracts and sample expected records.
Weeks 5–8: connect a narrow path. Implement an API, event or analytical ingestion path suited to the use case. Add monitoring, retries, lineage and a safe way to replay or correct data.
Weeks 9–10: reconcile with users. Compare sample rows and totals with source applications. Ask sales, marketing and finance to review the same examples. Resolve definition conflicts before polishing the dashboard.
Weeks 11–12: operationalize. Publish the metric dictionary, assign support ownership and set a recurring quality review. Measure usage and decision usefulness, not just whether the pipeline ran.
This sequence is a planning template, not a delivery guarantee. Data access approvals, complex identity rules and older systems can change the schedule. Keep the scope transparent and release useful increments when they are safe.
Common approaches that create new silos
Copying everything “just in case.” Broad ingestion increases access risk, storage and maintenance without proving value. Start with fields needed for the decision and add more only when an approved use case requires them.
Treating a middleware flow as a source of truth. A transformation can move or enrich data, but its output should not silently become authoritative for a business fact. Keep provenance and ownership visible.
Counting every influenced opportunity as incremental revenue. Attribution describes a chosen credit rule over observed interactions. It does not show what would have happened without the campaign. Use controlled experiments or other causal methods when the decision requires incremental impact.
Optimizing for a single dashboard. A dashboard is a presentation layer. The durable asset is the governed, documented data product behind it. If definitions exist only in chart formulas, teams will reproduce them differently.
Frequently asked questions
Do we need a data lake to connect sales and marketing?
No. A small analytical model or warehouse may meet the need. Choose the simplest store that supports the required history, scale, access and governance. Storage does not resolve conflicting definitions by itself.
Should the CRM be the single source of truth?
The CRM can be authoritative for sales relationships and stages, but finance, marketing and product systems own other facts. Aim for one agreed source per fact and a governed reporting view, not one application that owns everything.
Can multi-touch attribution prove that marketing caused revenue?
No. An attribution model assigns credit based on recorded interactions and selected rules. It can help describe journeys and allocate operational credit, but observed association is not proof of incremental impact. Combine it with experiments and sales context where the decision warrants stronger causal evidence.
Sources and further reading
For a scoped integration assessment, define the decision, systems and constraints before selecting a platform. FIX Solutions’ IT development services can support architecture and integration planning.